Sales drop and economic restrictive measures

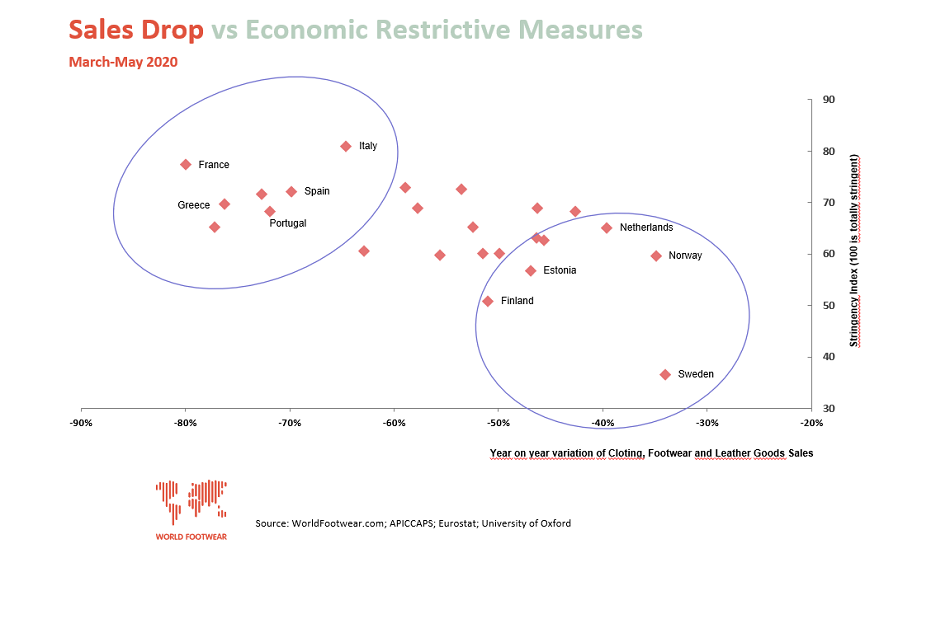
We have compared the Stringency Index as determined by the University of Oxford with the year on year variation of clothing, footwear and leather goods sales and have found a connection. Check it out
When comparing the Stringency Index, as determined by the University of Oxford, with the year on year variation of clothing, footwear and leather goods sales, there seems to be a connection between the number and strictness of government policies and the drop in retail sales of the fashion segment (clothing, footwear and leather goods):

The Oxford COVID-19 Government Response Tracker (OxCGRT) collects information on several different common policy responses that governments have taken to respond to the pandemic on 17 indicators such as school closures and travel restrictions.Eight of the policy indicators (C1-C8) record information on containment and closure policies, such as school closures and restrictions in movement. Four of the indicators (E1-E4) record economic policies, such as income support to citizens or provision of foreign aid. Five of the indicators (H1-H5) record health system policies such as the COVID-19 testing regime or emergency investments into healthcare.
The data from the 17 indicators is aggregated into a set of four common indices, reporting a number between 1 and 100 to reflect the level of government action on the topics in question:
- an overall government response index (which records how the response of governments has varied over all indicators in the database, becoming stronger or weaker over the course of the outbreak);
- a containment and health index (which combines ‘lockdown’ restrictions and closures with measures such as testing policy and contact tracing, short term investment in healthcare, as well investments in vaccine)
- an economic support index (which records measures such as income support and debt relief)
- as well as the original stringency index (which records the strictness of ‘lockdown style’ policies that primarily restrict people’s behaviour).
Note: these indices simply record the number and strictness of government policies, and should not be interpreted as ‘scoring’ the appropriateness or effectiveness of a country’s response. A higher position in an index does not necessarily mean that a country's response is ‘better’ than others lower on the index.


